Effect of Cooling Rate on
Ductile Iron Mechanical
Properties
G.M. Goodrich
Professional
Metallurgical Services, Buchanan, Michigan
R.W. Lobenhofer
Lobenhofer
Consulting, Inc., Mount Prospect, Illinois
Copyright 2002 American Foundry Society
abstract
This paper addresses the effect of cooling rate on ferritic ductile iron mechanical properties as determined by changing molding media and section size. It also addresses the effect of the as-cast skin on the mechanical properties and how the molding media and cooling rate can change the skin. The study was conducted by pouring various size cast-to-shape tensile specimens in the same molds made of either chemically bonded or green sand.
Testing some of those specimens in the as-cast conditions and others after machining showed that good correlations could be developed between the cast-to-shape specimens and tensile specimens poured in accordance with accepted standards; however, the correlation was different between the machined and as-cast specimens and between the specimens poured in the chemically bonded sand and green sand.
The analysis of the effect of the skin indicated a trend towards decreasing the ultimate strength and elongation and a trend toward increasing yield strength. The significantly different skin effect found from the two different molding medias indicated that this is an area that deserves additional consideration.
introduction
It has been known ductile iron properties are sensitive to differences in cooling rate; however, little documentation exists to indicate the extent that cooling rate differences change properties. While ductile iron castings are sold on the basis of their properties, usually the properties measured are from specimens poured in separately cast Y-Blocks or Keel Blocks. The relationship between those properties and the properties in castings poured from the same iron has been a matter of conjecture for some time. In order to assist designers in optimizing the design of ductile iron castings it is necessary for that relationship to be known. This work was designed to provide the initial phase in quantifying the relationship between properties and cooling rate for ferritic ductile castings.
In addition, it has been known for some time the casting
process forms a “skin” on ductile iron castings. It is common knowledge that
the microstructure of the iron close to the as-cast surface is different than
the microstructures of the same casting taken further away from the surface.
However, the effect of that skin on the mechanical properties has also not been
well documented. Once again, for the casting designer to optimize the design of
castings, that information is necessary. If strength is critical, should the
skin be left intact or should it be machined away? This work also provides the
initial answers to that question.
Literature review
A cursory literature review at the beginning of this project did not reveal significant information regarding the section sensitivity of ductile iron, particularly in the thickness range of less than one inch. The search is hindered by the belief that such work, if done, was done in the early stages of the acceptance of ductile iron. Such references are not part of the computerized databases that are easily searched.
The Ductile Iron Handbook on page 200 does show a graph that is purported to represent the section sensitivity. This same chart and the same reference source, Miller’s Compendium from 1975 appears in the Iron Castings Handbook, Iron Casting Society, 1981. After tracing back to the source of the graph, no information can be found as to how it was derived. Similarly, Steve Karsay in his book Ductile Iron II Engineering Design Properties Applications produced for Quebec Iron and Titanium on page 33 includes a table that indicates “approximate” effects of section size on the properties of ductile iron, but there is no information how the chart was derived. In Steve Karsay’s book Ductile Iron Production Practices, AFS, 1975 page 142 has a table showing the effect of section size on yield strength and elongation with a notation that the values are approximate and refer to average foundry practice. No source for the information is provided.
In some of the articles dealing with heavy section ductile iron there is information relating section thickness to changes in mechanical properties; however, those references relate the effects on very thick castings (2” and up).
A more in-depth literature search was attempted as part of the research to ascertain if information is available about how these dated charts were developed.
Literature Review Results
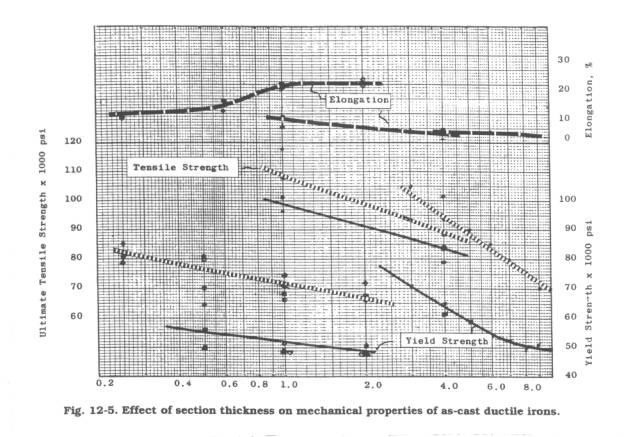
The charts that are in the Ductile Iron Handbook, page 200, and in the Iron Casting Handbook, page 335, are shown in Figures 1 and 2 respectively. Vennerholm et al 1 provided information about a high strength (as-cast pearlitic ductile iron) and a high ductility (as-cast ferritic ductile iron) that relates mechanical properties with section size. The information they developed shows relationships similar to those published in the two handbooks. Much of the work from Vennerholm et al, however, was related to the effect of magnesium content. Their work included evaluating the magnesium effects in 1-¼” keel blocks, 2”X2”X10”, 4”X4”X10”, 6”X6”10”, and 8”X8”X10” Y-blocks. They made the observation that the slope of the curve relating the tensile strength of pearlitic ductile iron to the section size was roughly parallel to that of reported information for gray iron. In other words, the tensile strength of pearlitic ductile iron was as sensitive to section size as gray iron. They also made the observation that the tensile strength of ferritic ductile iron in the thinner sections was more sensitive to section size up to approximately 2” sections than gray iron and less sensitive to section size in castings with larger sections size greater than 2”. This chart comparing their results to known information about gray iron is reproduced in Figure 3.
Figure
1 - Effect of section thickness on mechanical properties of as-cast ductile irons. (Ductile Iron Handbook, AFS 1992)

Figure 2- The effect of section size on the tensile and yield strengths of two ductile irons. The tensile strengths are indicated by the broken lines.
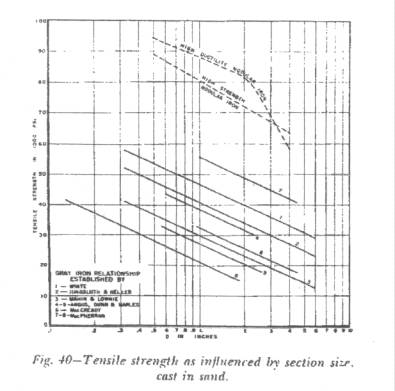
Figure 3 - Tensile strength as influenced by section size cast in sand.
C. C. Reynolds and H. F. Taylor published two papers that provided information relating mechanical properties to section size2,3. In their first paper, section size was varied from ½” to 4-½”. Their observations indicated that the tensile and yield properties of as-cast ferritic ductile iron dropped sharply from 93ksi and 70ksi in a ½” section to 80ksi and 60ksi in a 1” section. The tensile strength and yield strength properties continued to decrease more gradually to 70ksi and 53ksi for the 4-½” section. They further observed that the relationship “reflects directly the trend in relative amounts of pearlite transformed during solidification and cooling.”
In their second paper, Reynolds and Taylor evaluated the effect of alloying for section sizes from ¼” to 2”. However, the information presented was for irons that had base chemistries that are not representative of ductile irons produced today. The information they generated indicated that for the most part, as section size increased, ferrite content increased, tensile strength decreased, yield strength decreased and elongation increased, up to a point. They concluded that ferrite is more sensitive to the number of graphite nodules than any other constituent found in the as-cast structure. As a consequence, since nodule count decreases as section size increases, they found that in high silicon (3.3%) base ductile irons alloyed for higher strength (more pearlite), the ferrite content would increase as section size increased up to sections sizes of 1”. In sections sizes greater than 1”, the ferrite content actually decreased since the nodule count decreased. They observed “the small amount of ferrite in as-cast alloyed iron does not appear to be affected by the differences in cooling times of a ¼” and a 2” casting. This indicates that for alloyed spherulitic irons the amount of ferrite found is determined by a competitive process between the iron-iron carbide and iron-graphite systems during the eutectoid reaction.”
Discussion of Findings
Considering the history of ductile cast iron, the amount of information regarding the effect of section size on mechanical properties was noticeably scarce. Perhaps the scarcity reflects the fact that ductile iron producers believe that the property issue is casting and composition dependent and attempts to relate specific mechanical properties to specific section sizes would take away a degree of freedom from their manufacturing ability. With the advent of simulators and more sensitive thermal analysis tools, this degree of freedom is diminishing. Regardless of this observation, it was interesting to note that the literature was definitely void of comparisons between the mechanical properties and actual castings with the as cast surface intact.
The absence of literature information reflects the trends that most ductile iron producers recognize as inherent for ductile iron:
1. Ferritic ductile iron is generally more soft and ductile than pearlitic ductile iron.
2. Pearlitic ductile iron is generally stronger than ferritic ductile iron.
3. Fast cooling through the eutectoid reaction develops more pearlite than slow cooling.
4. Fast cooling through the eutectic develops more nodules than slow cooling.
5. A high nodule count iron cooling through the eutectoid will have more ferrite than a low nodule count iron cooling through the eutectoid, everything else being equal.
With these facts in mind, this literature review was encouraging from the standpoint that for fully pearlitic ductile irons, the mechanical properties were found to be as sensitive to section size as fully pearlitic gray irons. It was also interesting to find that the literature recognized the existence of two factors which influenced the sensitivity of sections size on mechanical properties for ferritic ductile irons, namely ferrite content from cooling rate through the eutectoid and ferrite content related to nodule count. In other words, an iron with a high nodule count could have more ferrite at a fast cooling rate through the eutectoid reaction than an iron with low nodule count and a slow cooling rate through the eutectoid reaction. This dichotomy could indicate a need for a better delineation between the effects that cooling rates through the eutectic, through the eutectoid, and alloy content have on the matrix structure. These facts individually are well recognized as inherent metallurgical events. Combining these three factors in a study of ductile iron matrix and mechanical properties has not been accomplished.
Experimental Procedure
Subsequent to the literature search, the first physical phase of the project was development of a pattern to produce cast to shape test bars of varying dimensions in a single mold. The development process for the pattern configuration was involved and is described in Appendix I. Figure 4 shows the pattern that was constructed with the positions numbered. The as-cast diameter of the bars in positions 1 and 2 was 0.625 inches; positions 3, 7, and 8 had as-cast diameters of 0.5 inches. The as-cast diameters of positions 4 and 6 were 0.375 inches and the as-cast diameter of position 5 was 0.25 inches. In all trials, bars poured in positions 5,6,7, and 8 were tested in the as-cast condition. Bars in positions 1 and 2 were machined to 0.5 inches before testing. Bars poured in position 3 were machined to 0.375 inches and those from position 4 were machined to 0.25 inches.
The pattern was taken to a foundry that pours ductile iron into chemically bonded sand molds. Ten molds were made from the pattern. The bonding of the sand was accomplished using the furan process. The sand used was made of 90% reclaimed sand. All of the molds, a Y-block test mold, and chemical analysis sample were poured from one ladle of 65-45-12 iron. The samples created were transported to a commercial laboratory where physical and chemical testing was conducted in accordance with applicable ASTM specifications.
Figure 4 – Final Pattern with Positions Marked
The pattern was then taken to a green sand foundry. At that foundry, ten molds were made using a squeezer molding machine. The sand used to produce the molds had 52 AFS Grain Fineness, 3.7% moisture, and 7.8% clay as determined by the Methylene Blue Method. Two of those molds were poured from each of five different ladles of as-cast ferritic ductile iron. Keel block tensile specimens and chemical analysis coupons were poured from each ladle of iron as well. Once again the samples were tested at the commercial laboratory in accordance with the appropriate ASTM specifications.
The raw data from the physical testing of the samples can be found in appendix III and the chemical analysis can be found in appendix IV.
Microstructural analyses were conducted on selected samples from each of the two foundries. Microprobe analysis was also performed on selected samples to help evaluate the cause of the skin effect.
Discussion of Results
As indicated in the Experimental Procedure section, the intention of the investigators was to evaluate an as-cast ferritic grade of ductile cast iron. The data in Appendix IV indicated that the five ladles used to produce the test molds in the green sand foundry and the single ladle used for the chemically bonded sand molds met these requirements. (See the keel block data at the end of the green sand foundry data indicating that the test bars had properties for a 65-45-12 ferritic ductile iron and the Y-block data for the chemically bonded sand foundry at the end of that data set that the material met requirements for a ferritic as cast 60-40-18 ductile iron.)
Skin
Effect
Evaluation of the data from the 160 test bars poured in the 20 test molds at the two foundries included a comparison with an accepted standard relationship as published in ASTM A536. The graph of all data points from the test bars showing the relationship between yield strength and elongation is shown in Figure 5. (A similar scatter of data existed when the ultimate tensile strength was compared to elongation for all of the test data.) The data plot for all of the data that compared the yield strength to elongation indicated a significant amount of scatter. However, when the data for the machined test bars was separated from the data from the bars tested with the as-cast surface, the scatter of the data displayed a different significance. Figure 6, for example, shows that the vast majority of data points that lie below the ASTM A536 minimum line (in the unacceptable region of the plot) were from the bars tested in the as-cast condition. Figure 7, in a similar manner, shows that a majority of data points that lie above the ASTM A536 minimum line (in the acceptable region) were from the bars that had been tested in the machined condition with the as-cast surface removed. (A similar effect existed when the ultimate tensile strength was compared to elongation.)
Figure 5. Comparing yield to elongation of all data to ASTM A536.

Figure 6. Comparing yield to elongation of the as cast test bars to ASTM A536.
Figure 7. Comparing yield to elongation of the machined test bars to ASTM A536.
The observation that the skin effect detrimentally affected the relationship between the yield strength and elongation (and ultimate strength and elongation) was expected. However, the dramatic significance of this effect as revealed with the comparison shown in Figures 5—7 was not expected. Further emphasizing this skin effect, two comparisons were made.
First, positions 3 and 7 were cast at the same diameter and consequently the same cooling rate. The test results for these two positions, however, compared a machined bar where the skin was removed, position 3, to an unmachined bar, position 7. In both the green sand and the chemically bonded sand, the yield strength, ultimate strength and the elongation increased once the skin was removed. It should be noted however, that skin effect affected the yield strength the least.
For the second comparison, the effect of the skin can be ascertained between parts machined to size and those that were cast to size. This data has several such comparisons. Position 1 (machined to 0.5 inch diameter) can be compared to Position 8 (cast to 0.5 inch diameter). Positions 2 and 7 were the same as positions 1 and 8 and can be compared in a similar manner. For smaller sizes, Position 3, machined to 0.375, can be compared to Position 6, cast to 0.375 inch diameter, and position 4, machined to 0.25 inch diameter, can be compared to position 5, cast to 0.25inch diameter. In these four comparisons, removal of the skin increased the elongation and the ultimate tensile strength. The skin effect on the yield strength was somewhat mixed. For all of the two smaller bar comparisons in both molding systems and all of the chemically bonded sand comparisons, removal of the skin reduced the yield strength. For the two larger bar comparison in the green sand, removal of the skin increased the yield strength.
In summary, these comparisons indicated that the skin reduces ultimate strength, reduces elongation, and depending on the extent of the skin effect increases yield strength. As section size decreases, and/or as the mold effect on the cooling of the skin increases, the effect of the skin is to increase yield strength. We believe this increase in yield strength was due to the presence of pearlite in the skin. Metallographic analysis indicated that the skin matrix was predominantly pearlite and that the effect extended to a depth of 0.0014 inches minimum and 0.0036 inches maximum (see Appendix VI). On a percentage basis, this skin effect was less pronounced on the larger bars, thus accounting for the less effect that the skin had on the yield strength of the larger bars and the more pronounced effect the skin had on yield strength of the smaller bars. Since pearlite has higher yield strength than ferrite, the skin effect on yield strength would be higher yield strength. The same reasoning should hold true for ultimate strength. However, the comparison was the opposite, indicating that the notches in the skin influenced the ultimate strength more than the pearlite matrix in the skin. Both the pearlite and the notches in the skin negatively affected elongation.
As a consequence of discovering the pronounced skin effect
in this investigation, evaluation of the microscopic quality of the as-cast
test bars was expanded beyond a simple metallographic analysis. Examples of the microstructure of test bars
both as-cast and machined revealed that the microstructure at the core of the
bars was consistent with normal expectations. The matrix was predominantly
ferrite and as the section size increased, the amount of ferrite
increased. Appendix VI provides a
comparison of the microstructures for the bars that were evaluated. A total of 32 bars from the 160 produced for
this study were evaluated metallographically.
All of the bars were sound at the fracture. No shrinkage porosity or gas porosity was present. Only one of the bars displayed dross at the
fracture.
The as-cast surface of the test bars from both the chemically bonded sand molds and the green sand molds was pearlitic with indications of oxidation at the surface. Figures 8—11 document a typical structure of the as-cast surface for one of the as-cast 0.5” diameter bars. Figure 12 illustrates a typical example of the core structure. Two of the metallographic samples, one representing molds from the chemically bonded sand and one representing molds from the green sand, were evaluated further using an electron probe to microscopically analyze the constituents. Both samples were from as cast 0.5” diameter bars from position 7 as shown in Figure 4 from the Experimental Procedure section. The analytical results are shown in Appendix VII.
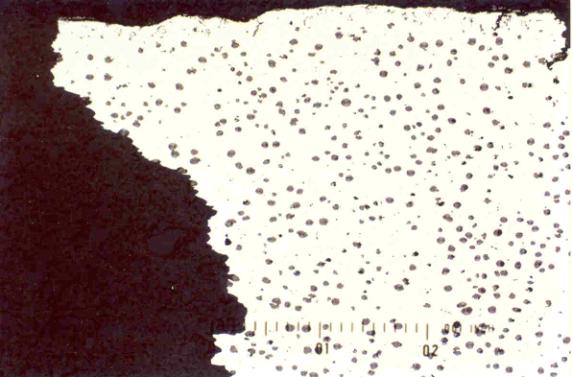
Figure 8. Photomicrograph of the fracture / a- cast surface interface for bar A7
(0.5” diameter as-cast). Unetched 112X Magnification. Divisions = 0.001” each.

Figure 9. Photomicrograph of the as-cast surface for bar A7
(0.5” diameter as-cast). Unetched 560X Magnification. Divisions = 0.0002” each.
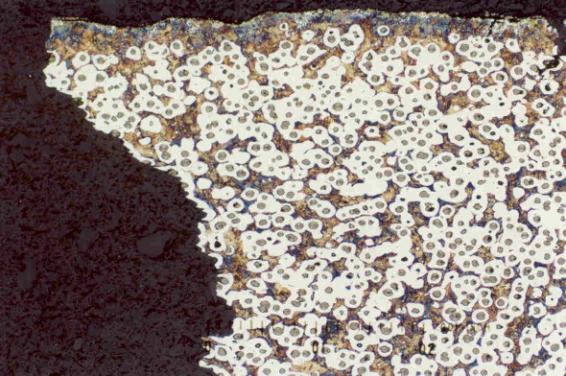
Figure 10. Photomicrograph of the fracture / as-cast surface interface for bar A7
(0.5” diameter as-cast). Etched 112X Magnification. Divisions = 0.001” each.
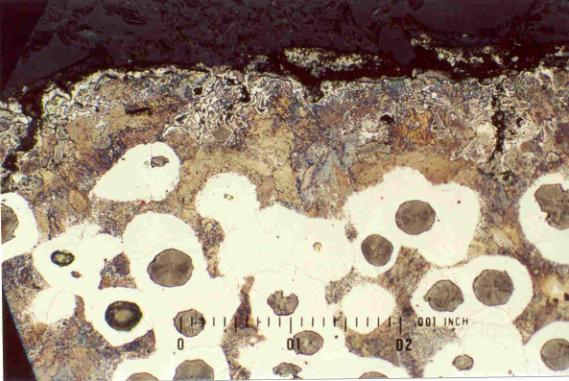
Figure 11. Photomicrograph of the as-cast surface for bar A7
(0.5” diameter as-cast). Etched 560X Magnification. Divisions = 0.0002” each.

Figure 12. Photomicrograph of the core structure for bar A7
(0.5” diameter as-cast) Etched 560X Magnification. Divisions = 0.0002” each.
Summarizing the microprobe analytical results, the partitioning of elements between the ferrite and the pearlite, particularly in the core, was as would be expected for the silicon, manganese, and the copper. Silicon, being a graphitizer, was in the ferrite, manganese, being a pearlite stabilizer, was in the pearlite. Copper was in the ferrite. At the as-cast surface for the chemically bonded molds, sulfur was present and contributed to the deleterious effect. The absence or reduced level of magnesium in the surface region also appears to have contributed to the creation of the skin effect for both molding systems. Oxidation is believed to have caused the magnesium depletion. Manganese also appeared to be more concentrated at the surface region for both molding systems. The conditions contributing to the deleterious effect experienced at the surface require additional study, beyond that conducted in this investigation, in order to provide a more definitive explanation. These results, however, indicated that a definitive analysis of the events that are occurring at the casting surface could lead to an increase in mechanical strength of the casting in the as-cast condition.
Effect of
Cooling Rate
The main purpose for this investigation was to identify the relationship between mechanical properties and cooling rate. In that regard, the test data were analyzed to ascertain and define this effect. To identify this relationship, the tensile data was normalized to the ASTM standard test bar data generated from the two foundries (y-block for the chemically bonded sand and keel blocks for the green sand) and compared to the surface area to volume ratio of the test bars in their as-cast condition whether they were machined or not. The surface area to volume ratio was selected as the comparison criteria since this parameter controls the rate the heat would be dissipated to the surrounding environment. The surface area to volume ratio assumed infinite length and was calculated for the gage portion of the castings. Two different molding media were selected to create a reasonable variation in the heat extraction environment and to represent examples of the extremes experience within the foundry industry.
Figures 13—15 document the relationship between the tensile properties and “cooling rate” (surface area to volume ratio) for the as-cast and machined bars from the green sand molds. In a similar manner, Figures 16—18 document the relationship between the tensile properties and the “cooling rate” for the as-cast and machined bars from the chemically bonded sand molds. Multiple regression analysis indicated that the data in each case could be represented with a straight line. The formulae for those lines are shown in table in Figure 18. Several observations are worth noting.

Figure 13. Plot of the yield strength determined for the green sand molded castings.
Figure 14. Plot of the ultimate strength determined for the green sand molded castings.

Figure 15. Plot of the elongation determined for the green sand molded castings.
Figure 16. Plot of the yield strength determined for the chemically bonded sand molded castings.
Figure 17. Plot of the ultimate strength determined for the chemically bonded sand molded castings.
Figure 18. Plot of the elongation determined for the chemically bonded sand molded castings.
Variable |
Intercept |
Slope |
Correlation Coefficient |
|
Green Sand-Yield Strength- Machined |
0.943931531 |
0.024592162 |
0.985769 |
|
Green Sand-Yield Strength- As Cast |
0.80543699 |
0.032602571 |
0.994359 |
|
Green Sand-Ultimate Strength-Machined |
0.985722009 |
0.01214478 |
0.684375 |
|
Green Sand-Ultimate Strength-As Cast |
0.853168549 |
0.017477125 |
0.962559 |
|
Green Sand-Elongation-Machined |
1.135996361 |
-00.86449793 |
0.881867 |
|
Green Sand-Elongation-As Cast |
0.319698473 |
-0.005907984 |
0.729788 |
|
Dry Sand-Yield Strength-Machined |
0.831381515 |
0.058114851 |
0.947922 |
|
Dry Sand-Yield Strength-As Cast |
0.650060854 |
0.076379749 |
0.96876 |
|
Dry Sand-Ultimate Strength-Machined |
0.837606958 |
0.05796021 |
0.962338 |
|
Dry Sand-Ultimate Strength- As Cast |
1.004119521 |
0.20068693 |
0.79117 |
|
Dry Sand-Elongation-Machined |
1.045717819 |
-0.08143431 |
0.771925 |
|
Dry Sand- Elongation-As Cast |
0.444605156 |
-0.026869583 |
0.929673 |
Figure 19. Table Showing Numerical Relationship Between Property
and Surface Area To Volume (Cooling Rate)
First, the correlation coefficient, particularly for the yield strengths of both molding systems, was close to unity. This aspect indicates that departure from the line (scatter) was minimal. However, the fact that each data point on the plots, indicated in Figures 13—18, represented the average of 10 tests should be kept in mind. (Two of the 0.25” diameter as-cast test bars from the chemically bonded sand molds had broken in transit and the data points for this diameter represents only eight test bars.) It should also be noted that correlation coefficients greater than 0.5 for equations generated from production data are considered to be a good representation of a fit to the data.
CONCLUSIONS
1. The skin on a ferritic grade of a ductile iron casting affects the properties of the casting:
a.
Lowers
elongation
b. Lowers ultimate tensile strength
c. Increases yield strength.
2.
The
effect of the skin on ferritic ductile iron castings diminishes as the section
size increases due to mass. Basically,
the skin becomes less of a factor because the condition is on the surface and
as the surface area to volume ratio decreases, the surface has less influence
on the properties.
3.
As the
surface area to volume ratio increases for a ferritic ductile iron casting (or
as cooling rate increases):
a.
Yield
strength increases linearly
b. Ultimate strength increases linearly
c.
Elongation
decreases linearly
4.
The
linearity of the relationship between cooling rate and mechanical properties is
also a function of the molding media.
In this investigation, the effect of green sand on the mechanical
properties was less pronounced than the effect of chemically bonded sand.
5. Fluid flow had an influence on cooling rate. In this investigation, changing the gating system changed the relationship between the properties of castings at different positions in the mold. (Quantifying this effect was beyond the scope of this investigation.)
RECOMMENDATIONS
1.
The
scope of study should be expanded to include the influence of cooling rate and
skin effect on mechanical properties of other ductile grades.
2.
The
scope of study should be expanded to determine if relationship between cooling
rate and skin effect investigated in this study extends to even larger casting
sizes.
3.
The
effect of the skin on mechanical properties should be studied further to
identify the factors contributing to the cause so that the effect of the skin
can be minimized.
4.
The
effect of fluid flow on cooling rate in a mold should be studied further and
quantified if possible to further incorporate this factor into the relationship
between cooling rate and mechanical properties. This aspect would be a particularly important factor for
establishing casting parameters for thin walled ductile iron castings.
acknowledgments
The researchers gratefully acknowledge the participation and input that the sponsoring committee, 5J, the Quality Control Committee of the American Foundry Society Cast Iron Division and their monitoring committee, provided throughout the course of this investigation. The researchers are particularly grateful to the two foundries, Seneca Foundry in Webster City, Iowa, and Clearfield Machine Co in Clearfield, Pennsylvania for providing castings required for this investigation. Three commercial laboratories are also gratefully acknowledged for doing the testing at a substantially reduced rate, Bodycote Material Testing, Taussig Laboratories in Skokie, Illinois; Anderson Laboratory in Greendale Wisconsin; and Climax Research Services in Wixom, Michigan. Lastly, the researchers gratefully appreciate their companies, Lobenhofer Consulting, Mount Prospect, Illinois, and Professional Metallurgical Services, Buchanan, Michigan, for permitting them to perform this study.
REFERENCES
1. Section Size Relationships in Nodular Iron, G. Vennerholm, H. Bogart, & R. Melmoth, AFS Transactions, 1950, pg 174.
2. Mechanical properties of Spherulitic Graphite Cast Iron, C.C. Reynolds & H.F. Taylor, AFS Transactions, 1952, pg 687.
3. Alloying and Heat Treating Spherulitic Graphite Cast Iron, C. C. Reynolds, & H. F. Taylor, AFS Transactions, 1954, pg 181.
Appendix I - Development of Pattern
The first stage of the project was to design a pattern to produce cast to shape tensile specimens that would give tensile results that would not be effected by the position of the bar in the mold. Using a basic concept for the pattern design, a computer simulation was performed. While the simulation of the initial effort showed no problems, trying to fit that design into the available flask sizes, required some modification to the idealized gating initially simulated. In particular, the extension on the runner bar past the last casting was reduced to the point that putting a sump at the end of the runner bar was impossible.
The modified design was also simulated and showed no problems. The pattern shown in Appendix I - Figure 1 was constructed from that design.
Appendix I - Figure 1 - First Pattern
Grade 65-45-12 ductile iron was poured into three molds, and the bars produced were tested. Initial scanning of those results did not reveal any position-based bias; however, more careful study of the results suggested that slightly different cooling rates occurred.
Since the three molds were poured at different times, the results were not expected to be identical. To compensate for that, the data was normalized. Averaging the results from a mold and then determining the difference between the results at each position and the average accomplished the normalization. Plotting the results showed differences in the properties dependent on position. Appendix I - Figure 2 shows the plot of the normalized ultimate strength data.

Appendix I - Figure 2 – First Test Normalized Ultimate Results
Statistical analysis of the data confirmed the position bias. By comparing the normalized averages at each of the positions, it was shown that that there were statistically significant differences (at a greater than 95% confidence level) between the averages at most of the positions. It was suggested that normalizing the data might in itself be creating some of the bias; therefore, the raw data was analyzed. Similar results were found as is shown in the table in Appendix I - Figure 3.
It was decided that the test would be repeated to verify the results. Unfortunately, the results were verified. As can be seen in Appendix I - Figures 4 & 5.
|
Normalized |
Z |
Probability Difference not Caused by Random |
|
Raw Data |
Z |
Probability Difference not Caused by Random |
|
1 vs 2 |
2.262 |
>99.0% |
|
1 vs 2 |
1.743 |
|
|
1 vs 3 |
0.768 |
|
|
1 vs 3 |
0.743 |
|
|
1 vs 4 |
3.208 |
>99.8% |
|
1 vs 4 |
3.042 |
>99.5% |
|
2 vs 3 |
2.408 |
>95.0% |
|
2 vs 3 |
2.051 |
>95.0% |
|
2 vs 4 |
3.945 |
>99.8% |
|
2 vs 4 |
3.473 |
>99.8% |
|
3 vs 4 |
2.474 |
>95.0% |
|
3 vs 4 |
2.563 |
>95.0% |
Appendix I - Figure 3 – Comparison of Averages by Position –Ultimate – First Trial
|
Normalized |
Z |
Probability Difference not Caused by Random |
Raw Data |
Z |
Probability Difference not Caused by Random |
|
1 vs 2 |
3.1620 |
>99.8% |
1 vs 2 |
2.0290 |
>95.0% |
|
1 vs 3 |
1.6130 |
|
1 vs 3 |
1.0180 |
|
|
1 vs 4 |
3.2540 |
>99.8% |
1 vs 4 |
2.0530 |
>95.0% |
|
2 vs 3 |
0.8670 |
|
2 vs 3 |
0.4750 |
|
|
2 vs 4 |
6.0480 |
>99.8% |
2 vs 4 |
3.2180 |
>99.8% |
|
3 vs 4 |
4.1040 |
>99.8% |
3 vs 4 |
2.2830 |
>95.0% |
Appendix I - Figure 4 – Statistical Comparison of Averages by Position – Ultimate -Both Tests
|
Normalized |
Z |
Probability Difference not Caused by Random |
Raw Data |
|
Probability Difference not Caused by Random |
|
1 vs 2 |
1.773 |
>90.0% |
1 vs 2 |
1.049 |
|
|
1 vs 3 |
0.409 |
|
1 vs 3 |
0.265 |
|
|
1 vs 4 |
2.905 |
>99.5% |
1 vs 4 |
1.538 |
|
|
2 vs 3 |
1.167 |
|
2 vs 3 |
0.992 |
|
|
2 vs 4 |
4.400 |
>99.8% |
2 vs 4 |
2.918 |
>99.5% |
|
3 vs 4 |
2.876 |
>99.5% |
3 vs 4 |
2.144 |
>95.0% |
Appendix I - Figure 5 – Statistical Comparison of Averages by Position – Yield - Both Tests
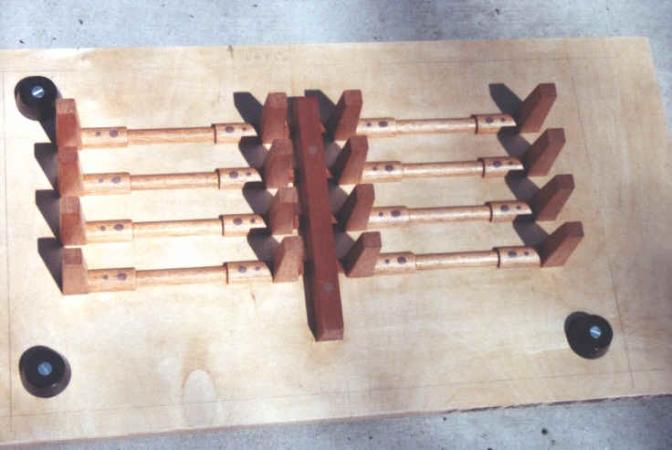
Another design was developed with a more symmetrical arrangement in hopes to alleviate the positional differences. It is shown in Appendix I - Figure 6. Three molds were made and poured from the redesigned pattern.

Appendix I - Figure 6 - Redesigned cope pattern with identification markings
As would be expected results varied from mold to mold, even though they were poured from the same ladle. Color-coding identified the three sets of castings. This allowed the comparison of results from the same mold. As was done with the results from the tests poured from the first pattern, the results were normalized by position. Taking the average of the results of all bars within a mold and then calculating the difference from that average by position accomplished this. The raw data from these initial tests can be found in Appendix II and Appendix III
Logically, if differences were to be found, it would be expected to be between the bars closer to the downsprue and those on the outside. Using the statistical comparison of average test it was found that there was a statistically significant difference based upon the inside/outside positioning. As can be seen in Appendix I - Figure 7, the “Z” factors are high enough to conclude, particularly in the normalized data, that it is very unlikely the difference in averages happened because of random distribution of the data. (A “Z” of over 1.645 indicates that there is less than a 10% chance the difference occurred because of randomness. A “Z” over 1.96 indicates less than 5%.)
|
Variable Name |
Z |
Average of Outside Readings |
Standard Deviation of Outside Readings |
Number of Outside Readings |
Average of Inside Readings |
Standard Deviation of Inside Readings |
Number of Inside Readings |
|
Normalized per mold Yield |
3.8135 |
0.43375 |
0.7501 |
12 |
-0.43375 |
0.241468 |
12 |
|
Yield, ksi |
3.2574 |
54.54667 |
0.824316 |
12 |
55.41417 |
0.4143 |
12 |
|
Normalized per mold Tensile |
1.9192 |
0.464167 |
1.213626 |
12 |
-0.46417 |
1.155276 |
12 |
|
Tensile, ksi |
1.2052 |
79.71417 |
1.847069 |
12 |
80.6425 |
1.925707 |
12 |
Appendix I - Figure 7 - Table Comparing Outside/Inside Averages
Although differences remained, the variation by position in the second pattern is significantly less than that which occurred in the tests using the first pattern. Appendix I - Figure 8 shows the comparison of the averages for the positions from the three tests connected with the pattern development.
 Appendix I - Figure 8
– Comparison by Positions Pattern Tests
Appendix I - Figure 8
– Comparison by Positions Pattern Tests
The data was also checked for relationship between left and right and the top and bottom of the mold. While differences were detected, they were not as statistically significant as those between the outside and inside.
At this point it was decided instead of spending additional time trying to develop a pattern that would produce identical results in all positions, a pattern would be used that would allow comparison of the results from the inside and outside positions.
Appendix II - Tensile Results From First Pattern (Tree)
|
First Trial – First Pattern |
|||||
|
Sample |
Tensile, ksi |
Yield, ksi |
% Elongation |
Comments |
HBW |
|
L1Box1 |
80.3 |
52.8 |
4.95 |
|
173 |
|
L2Box1 |
80.6 |
52.7 |
N/A |
BOG |
171 |
|
L3Box1 |
81.5 |
52.3 |
N/A |
BOG |
174 |
|
L4Box1 |
79.6 |
52.6 |
4.95 |
|
175 |
|
R1Box1 |
80.7 |
52.6 |
4.95 |
|
176 |
|
R2Box1 |
79.1 |
50 |
N/A |
|
164 |
|
R3Box1 |
79.9 |
55.5 |
5.45 |
|
176 |
|
R4Box1 |
82.1 |
52.5 |
5.45 |
|
171 |
|
KeelBox1 |
74 |
45.7 |
14.85 |
|
163 |
|
L1Box2 |
81.1 |
50.4 |
6.93 |
|
175 |
|
L2Box2 |
79.6 |
50.2 |
6.93 |
|
171 |
|
L3Box2 |
81.3 |
51.9 |
6.93 |
|
170 |
|
L4Box2 |
83.3 |
51.7 |
7.92 |
|
176 |
|
R1Box2 |
80.7 |
51.5 |
6.93 |
|
170 |
|
R2Box2 |
81.1 |
53.4 |
N/A |
BOG |
174 |
|
R3Box2 |
8.2 |
51.1 |
N/A |
BOG |
171 |
|
R4Box2 |
82.7 |
52.3 |
6.93 |
|
174 |
|
KeelBox2 |
73.2 |
45.7 |
10.89 |
|
156 |
|
L1Box3 |
79.9 |
50.4 |
8.91 |
|
169 |
|
L2Box3 |
75.6 |
49.4 |
8.91 |
|
161 |
|
L3Box 3 |
8.4 |
50.9 |
6.93 |
|
167 |
|
L4Box3 |
82.4 |
53.1 |
7.43 |
|
174 |
|
R1Box3 |
79.7 |
49 |
10.89 |
|
154 |
|
R2Box3 |
77.8 |
50.1 |
7.43 |
|
164 |
|
R3Box3 |
80.6 |
51.5 |
7.43 |
|
159 |
|
R4Box3 |
83.3 |
52.1 |
7.43 |
|
173 |
|
KeelBox3 |
72.2 |
45.5 |
17.33 |
|
148 |
|
Second Trial - First Pattern |
|||||
|
Sample |
Tensile, ksi |
Yield, ksi |
% Elongation |
Comments |
HBW |
|
L1Box1 |
79.22 |
53.95 |
6 |
BOG |
173 |
|
L2Box1 |
76.76 |
52.56 |
6 |
|
161 |
|
L3Box1 |
75.94 |
53.33 |
6 |
|
181 |
|
L4Box1 |
84.38 |
55.1 |
7 |
|
173 |
|
R1Box1 |
81.61 |
54.64 |
7 |
|
181 |
|
R2Box1 |
80.71 |
53.8 |
6.5 |
BOG |
186 |
|
R3Box1 |
82.81 |
53.45 |
7.5 |
|
176 |
|
R4Box1 |
84.62 |
55.42 |
7.5 |
|
181 |
|
KeelBox1 |
76.33 |
48.66 |
13 |
|
155 |
|
L1Box2 |
80.19 |
53.5 |
6.5 |
|
174 |
|
L2Box2 |
79.02 |
52.63 |
7 |
|
166 |
|
L3Box2 |
79.45 |
52.58 |
6 |
BOG |
166 |
|
L4Box2 |
82.75 |
54.88 |
6.5 |
|
183 |
|
R1Box2 |
78.45 |
53.76 |
5.71 |
0.356Dia. |
--------- |
|
R2Box2 |
78.09 |
53.19 |
6 |
|
172 |
|
R3Box2 |
76.82 |
52.11 |
6 |
|
165 |
|
R4Box2 |
81.41 |
53.99 |
6.5 |
|
181 |
|
KeelBox2 |
72.21 |
46.89 |
17.5 |
|
151 |
|
L1Box3 |
78.03 |
53.78 |
5 |
BOG |
185 |
|
L2Box3 |
72.76 |
51.86 |
5 |
|
171 |
|
L3Box 3 |
71.56 |
50.97 |
6 |
|
173 |
|
L4Box3 |
78.43 |
53.42 |
6.5 |
|
182 |
|
R1Box3 |
77.03 |
53.18 |
6.5 |
|
169 |
|
R2Box3 |
74.48 |
51.27 |
7 |
|
175 |
|
R3Box3 |
73.26 |
51.87 |
6 |
|
171 |
|
R4Box3 |
74.49 |
53.82 |
5 |
|
179 |
|
KeelBox3 |
73.97 |
48.08 |
12.5 |
|
152 |
Appendix III – Tensile Data from Second Pattern (H)
|
Sample |
Tensile, ksi |
Yield, ksi |
% Elongation |
Comments |
HBW |
|
L-1-B Black |
81.15 |
54.89 |
6.5 |
x |
172 |
|
R-1-B Black |
81.92 |
54.76 |
7.5 |
x |
173 |
|
L-2-B Black |
82.83 |
55.06 |
6.5 |
B.O.G. |
176 |
|
R-2-B Black |
83.87 |
54.71 |
7.5 |
x |
180 |
|
L-3-T Black |
82.63 |
55.41 |
6 |
B.O.G. |
178 |
|
R-3-T Black |
79.67 |
55.53 |
5.5 |
x |
178 |
|
L-4-T Black |
79.6 |
54.47 |
6 |
B.O.G. |
174 |
|
R-4-T Black |
83.22 |
52.6 |
8.5 |
x |
176 |
|
L-1-B Gray |
79.07 |
55 |
5.5 |
x |
176 |
|
R-1-B Gray |
80.77 |
54.47 |
5.5 |
B.O.G. |
177 |
|
L-2-B Gray |
80.85 |
55.88 |
5.5 |
x |
178 |
|
R-2-B Gray |
79.87 |
55.89 |
5.5 |
x |
181 |
|
L-3-T Gray |
82.1 |
55.67 |
5.5 |
x |
179 |
|
R-3-T Gray |
81.27 |
56.07 |
6 |
x |
188 |
|
L-4-T Gray |
78.5 |
55.29 |
5 |
x |
181 |
|
R-4-T Gray |
79.6 |
55.18 |
5.5 |
B.O.G. |
179 |
|
L-1-B No Paint |
79.19 |
54.4 |
5 |
x |
170 |
|
R-1-B No Paint |
79.05 |
55.21 |
5.5 |
x |
178 |
|
L-2-B No Paint |
77.94 |
55.43 |
4.5 |
x |
174 |
|
R-2-B No Paint |
79.56 |
55.14 |
5 |
x |
176 |
|
L-3-T No Paint |
78.12 |
55.21 |
5 |
x |
178 |
|
R-3-T No Paint |
79 |
54.97 |
5.5 |
x |
179 |
|
L-4-T No Paint |
76.15 |
55.03 |
4.5 |
x |
174 |
|
R-4-T No Paint |
78.35 |
53.26 |
5 |
x |
181 |
Appendix IV – Raw Physical Data From Sensitivity Tests
Chemically Bonded Sand
|
Test # (Mold|Position) |
Dia |
Yield |
Tensile |
Elong |
|
A1 |
0.501 |
48.25 |
78.66 |
9.88 |
|
B1 |
0.500 |
49.09 |
78.42 |
9.18 |
|
C1 |
0.501 |
48.10 |
79.55 |
9.34 |
|
D1 |
0.501 |
49.69 |
78.83 |
8.06 |
|
E1 |
0.501 |
48.46 |
77.27 |
8.25 |
|
F1 |
0.501 |
49.19 |
80.71 |
11.33 |
|
G1 |
0.500 |
49.50 |
80.28 |
7.06 |
|
H1 |
0.500 |
48.50 |
79.36 |
7.79 |
|
I1 |
0.500 |
47.98 |
79.49 |
9.61 |
|
J1 |
0.501 |
49.33 |
79.29 |
8.29 |
|
Average |
0.501 |
48.809 |
79.186 |
8.879 |
|
Std
Dev |
0.001 |
0.621 |
0.969 |
1.236 |
|
|
|
|
|
|
|
A2 |
0.501 |
51.70 |
82.86 |
8.34 |
|
B2 |
0.502 |
51.50 |
83.18 |
7.96 |
|
C2 |
0.501 |
52.45 |
82.65 |
7.56 |
|
D2 |
0.499 |
49.85 |
79.23 |
7.06 |
|
E2 |
0.500 |
50.87 |
82.62 |
10.03 |
|
F2 |
0.500 |
52.41 |
85.41 |
8.91 |
|
G2 |
0.500 |
52.94 |
84.56 |
7.45 |
|
H2 |
0.499 |
51.70 |
83.63 |
8.30 |
|
I2 |
0.500 |
51.74 |
83.07 |
7.61 |
|
J2 |
0.499 |
52.05 |
82.18 |
6.76 |
|
Average |
0.500 |
51.721 |
82.939 |
7.998 |
|
Std
Dev |
0.001 |
0.874 |
1.627 |
0.956 |
|
|
|
|
|
|
|
A3 |
0.375 |
55.19 |
86.43 |
7.01 |
|
B3 |
0.373 |
55.80 |
85.63 |
6.14 |
|
C3 |
0.374 |
55.26 |
84.82 |
4.70 |
|
D3 |
0.373 |
54.91 |
86.77 |
7.33 |
|
E3 |
0.375 |
54.94 |
89.58 |
9.54 |
|
F3 |
0.373 |
55.73 |
88.71 |
6.31 |
|
G3 |
0.373 |
56.10 |
92.33 |
7.93 |
|
H3 |
0.373 |
55.63 |
90.11 |
10.31 |
|
I3 |
0.374 |
54.09 |
86.10 |
5.90 |
|
J3 |
0.375 |
54.84 |
86.46 |
5.70 |
|
Average |
0.374 |
55.249 |
87.694 |
7.087 |
|
Std
Dev |
0.001 |
0.590 |
2.379 |
1.755 |
|
|
|
|
|
|
|
A4 |
0.250 |
62.15 |
98.05 |
6.96 |
|
B4 |
0.249 |
62.49 |
100.20 |
8.05 |
|
C4 |
0.249 |
63.37 |
99.54 |
5.74 |
|
D4 |
0.249 |
63.94 |
103.29 |
5.69 |
|
E4 |
0.249 |
64.11 |
101.67 |
7.80 |
|
F4 |
0.249 |
64.61 |
104.13 |
6.86 |
|
G4 |
0.248 |
65.83 |
104.67 |
5.50 |
|
H4 |
0.247 |
64.60 |
104.33 |
6.80 |
|
I4 |
0.249 |
65.59 |
105.19 |
6.29 |
|
J4 |
0.250 |
65.09 |
103.50 |
5.75 |
|
Average |
0.249 |
64.178 |
102.457 |
6.544 |
|
Std
Dev |
0.001 |
1.229 |
2.452 |
0.903 |
|
|
|
|
|
|
|
A5 |
0.257 |
78.05 |
86.27 |
0.00 |
|
B5 |
0.264 |
75.94 |
83.15 |
0.70 |
|
C5 |
0.262 |
76.44 |
89.28 |
1.19 |
|
D5 |
0.256 |
78.57 |
96.91 |
1.48 |
|
E5 |
0.259 |
73.30 |
84.83 |
0.00 |
|
F5 |
? |
? |
? |
? |
|
G5 |
0.257 |
81.62 |
92.92 |
1.14 |
|
H5 |
0.255 |
82.30 |
92.81 |
0.84 |
|
I5 |
0.266 |
76.35 |
90.28 |
1.44 |
|
J5 |
? |
? |
? |
? |
|
Average |
0.260 |
77.821 |
89.556 |
0.849 |
|
Std
Dev |
0.004 |
3.004 |
4.641 |
0.587 |
|
|
|
|
|
|
|
A6 |
0.379 |
62.58 |
78.51 |
1.26 |
|
B6 |
0.386 |
64.37 |
87.06 |
2.80 |
|
C6 |
0.320 |
65.74 |
85.92 |
2.18 |
|
D6 |
0.379 |
67.51 |
88.91 |
2.38 |
|
E6 |
0.384 |
64.50 |
87.33 |
2.35 |
|
F6 |
0.360 |
63.65 |
89.55 |
3.92 |
|
G6 |
0.380 |
66.62 |
92.49 |
3.62 |
|
H6 |
0.378 |
68.45 |
90.72 |
2.56 |
|
I6 |
0.383 |
65.50 |
86.75 |
2.71 |
|
J6 |
0.390 |
67.02 |
89.44 |
2.37 |
|
Average |
0.374 |
65.594 |
87.668 |
2.615 |
|
Std
Dev |
0.021 |
1.841 |
3.787 |
0.743 |
|
|
|
|
|
|
|
A7 |
0.510 |
54.86 |
78.40 |
4.07 |
|
B7 |
0.510 |
54.59 |
80.73 |
4.91 |
|
C7 |
0.504 |
55.35 |
78.21 |
3.59 |
|
D7 |
0.503 |
55.08 |
79.87 |
3.94 |
|
E7 |
0.503 |
56.08 |
84.31 |
4.48 |
|
F7 |
0.513 |
53.04 |
80.68 |
5.68 |
|
G7 |
0.504 |
55.02 |
83.90 |
4.93 |
|
H7 |
0.500 |
57.39 |
84.18 |
4.63 |
|
I7 |
0.519 |
53.69 |
76.79 |
4.21 |
|
J7 |
0.513 |
54.37 |
78.05 |
4.10 |
|
Average |
0.508 |
54.947 |
80.512 |
4.454 |
|
Std
Dev |
0.006 |
1.207 |
2.779 |
0.607 |
|
|
|
|
|
|
|
A8 |
0.508 |
51.64 |
78.17 |
5.27 |
|
B8 |
0.521 |
50.33 |
75.81 |
5.24 |
|
C8 |
0.506 |
51.81 |
79.82 |
6.42 |
|
D8 |
0.506 |
51.04 |
73.20 |
3.90 |
|
E8 |
0.504 |
53.14 |
77.56 |
4.91 |
|
F8 |
0.509 |
46.49 |
77.14 |
5.65 |
|
G8 |
0.498 |
53.92 |
81.38 |
5.88 |
|
H8 |
0.498 |
54.16 |
81.44 |
5.51 |
|
I8 |
0.515 |
50.72 |
74.59 |
5.04 |
|
J8 |
0.518 |
51.95 |
77.79 |
5.74 |
|
Average |
0.508 |
51.520 |
77.690 |
5.356 |
|
Std
Dev |
0.008 |
2.192 |
2.710 |
0.675 |
|
|
|
|
|
|
|
|
|
|
|
|
|
Y-Block |
|
43.12* |
68.71 |
20.28 |
*
retested at 45.5 at second laboratory
Green Sand
|
Test
# (Pour # - Position {X=Second Mold Poured}) |
Dia |
Yield |
Tensile |
Elong |
|
1-1 |
0.502 |
52.06 |
83.21 |
13.18 |
|
1-1X |
0.501 |
52.95 |
83.41 |
12.96 |
|
2-1 |
0.503 |
55.21 |
83.91 |
14.18 |
|
2-1X |
0.502 |
51.68 |
82.49 |
11.05 |
|
3-1 |
0.503 |
52.38 |
82.44 |
9.97 |
|
3-1X |
0.502 |
53.73 |
79.54 |
6.99 |
|
4-1 |
0.503 |
51.52 |
82.83 |
13.16 |
|
4-1X |
0.502 |
52.54 |
82.63 |
9.27 |
|
5-1 |
0.502 |
53.45 |
80.42 |
7.05 |
|
5-1X |
0.502 |
53.96 |
78.45 |
6.87 |
|
Average |
0.502 |
52.948 |
81.933 |
10.468 |
|
Std
Dev |
0.001 |
1.151 |
1.817 |
2.855 |
|
|
|
|
|
|
|
1-2 |
0.504 |
51.99 |
81.85 |
13.33 |
|
1-2X |
0.504 |
53.11 |
82.93 |
10.45 |
|
2-2 |
0.504 |
52.56 |
83.93 |
13.15 |
|
2-2X |
0.504 |
50.82 |
82.89 |
13.14 |
|
3-2 |
0.504 |
52.57 |
83.79 |
11.14 |
|
3-2X |
0.507 |
54.34 |
81.70 |
7.22 |
|
4-2 |
0.504 |
53.26 |
81.33 |
8.49 |
|
4-2X |
0.504 |
52.48 |
83.45 |
10.73 |
|
5-2 |
0.504 |
53.61 |
75.96 |
4.48 |
|
5-2X |
0.503 |
52.26 |
77.82 |
6.32 |
|
Average |
0.504 |
52.700 |
81.565 |
9.845 |
|
Std
Dev |
0.001 |
0.961 |
2.652 |
3.104 |
|
|
|
|
|
|
|
1-3 |
0.374 |
52.13 |
79.42 |
6.80 |
|
1-3X |
0.375 |
53.96 |
79.73 |
5.13 |
|
2-3 |
0.374 |
53.17 |
76.86 |
5.54 |
|
2-3X |
0.375 |
55.42 |
82.75 |
6.61 |
|
3-3 |
0.375 |
53.78 |
78.08 |
4.82 |
|
3-3X |
0.375 |
53.56 |
79.47 |
5.87 |
|
4-3 |
0.374 |
53.75 |
77.96 |
5.00 |
|
4-3X |
0.375 |
52.99 |
77.67 |
4.99 |
|
5-3 |
0.375 |
54.92 |
78.40 |
4.62 |
|
5-3X |
0.375 |
53.40 |
77.57 |
5.21 |
|
Average |
0.375 |
53.708 |
78.791 |
5.459 |
|
Std
Dev |
0.000 |
0.936 |
1.675 |
0.746 |
|
|
|
|
|
|
|
1-4 |
0.250 |
60.43 |
80.13 |
4.76 |
|
1-4X |
0.250 |
59.05 |
84.97 |
4.82 |
|
2-4 |
0.251 |
57.71 |
82.89 |
6.05 |
|
2-4X |
0.250 |
57.34 |
83.00 |
5.79 |
|
3-4 |
0.250 |
58.51 |
82.62 |
4.92 |
|
3-4X |
0.250 |
57.97 |
84.64 |
5.81 |
|
4-4 |
0.250 |
57.29 |
84.24 |
5.21 |
|
4-4X |
0.250 |
55.84 |
81.51 |
4.61 |
|
5-4 |
0.250 |
57.86 |
90.51 |
7.97 |
|
5-4X |
0.250 |
58.04 |
85.14 |
6.30 |
|
Average |
0.250 |
58.004 |
83.965 |
5.624 |
|
Std
Dev |
0.000 |
1.201 |
2.797 |
1.016 |
|
|
|
|
|
|
|
1-5 |
0.261 |
60.62 |
80.44 |
3.89 |
|
1-5X |
0.255 |
x |
86.37 |
4.37 |
|
2-5 |
0.259 |
64.95 |
82.61 |
4.23 |
|
2-5X |
0.266 |
57.66 |
89.51 |
2.58 |
|
3-5 |
0.261 |
63.55 |
82.91 |
4.80 |
|
3-5X |
0.260 |
63.38 |
83.30 |
3.56 |
|
4-5 |
0.257 |
x |
84.19 |
2.76 |
|
4-5X |
0.257 |
66.16 |
82.95 |
3.54 |
|
5-5 |
0.262 |
63.43 |
87.13 |
4.53 |
|
5-5X |
0.269 |
62.90 |
82.07 |
4.82 |
|
Average |
0.261 |
62.831 |
84.148 |
3.908 |
|
Std
Dev |
0.004 |
2.629 |
2.722 |
0.794 |
|
|
|
|
|
|
|
1-6 |
0.388 |
52.92 |
80.21 |
4.05 |
|
1-6X |
0.391 |
56.79 |
81.28 |
4.84 |
|
2-6 |
0.395 |
53.80 |
80.57 |
5.49 |
|
2-6X |
0.406 |
54.75 |
76.86 |
5.17 |
|
3-6 |
0.391 |
55.07 |
82.10 |
5.51 |
|
3-6X |
0.390 |
54.72 |
77.80 |
3.69 |
|
4-6 |
0.391 |
52.83 |
79.58 |
5.21 |
|
4-6X |
0.393 |
53.63 |
76.60 |
3.87 |
|
5-6 |
0.398 |
57.39 |
78.17 |
4.18 |
|
5-6X |
0.398 |
54.46 |
77.61 |
6.16 |
|
Average |
0.394 |
54.636 |
79.078 |
4.817 |
|
Std
Dev |
0.005 |
1.505 |
1.927 |
0.828 |
|
|
|
|
|
|
|
1-7 |
0.521 |
50.95 |
76.21 |
4.56 |
|
1-7X |
0.524 |
52.90 |
77.70 |
6.09 |
|
2-7 |
0.524 |
50.39 |
73.92 |
4.13 |
|
2-7X |
0.552 |
50.71 |
75.41 |
4.17 |
|
3-7 |
0.521 |
51.31 |
74.32 |
4.25 |
|
3-7X |
0.520 |
50.85 |
75.07 |
4.84 |
|
4-7 |
0.521 |
49.77 |
73.64 |
4.77 |
|
4-7X |
0.521 |
50.44 |
75.81 |
5.48 |
|
5-7 |
0.525 |
52.00 |
77.54 |
5.36 |
|
5-7X |
0.524 |
52.42 |
72.65 |
4.52 |
|
Average |
0.525 |
51.174 |
75.227 |
4.817 |
|
Std
Dev |
0.010 |
0.985 |
1.651 |
0.643 |
|
|
|
|
|
|
|
1-8 |
0.518 |
49.85 |
75.11 |
5.31 |
|
1-8X |
0.522 |
50.66 |
76.32 |
4.33 |
|
2-8 |
0.514 |
51.78 |
77.24 |
4.92 |
|
2-8X |
0.559 |
49.09 |
69.86 |
5.83 |
|
3-8 |
0.522 |
50.30 |
73.33 |
4.79 |
|
3-8X |
0.520 |
52.31 |
70.36 |
2.93 |
|
4-8 |
0.520 |
50.72 |
74.25 |
5.08 |
|
4-8X |
0.517 |
50.86 |
72.27 |
4.45 |
|
5-8 |
0.529 |
51.11 |
74.46 |
4.68 |
|
5-8X |
0.515 |
51.77 |
70.76 |
3.50 |
|
Average |
0.524 |
50.845 |
73.396 |
4.582 |
|
Std
Dev |
0.013 |
0.964 |
2.540 |
0.849 |
|
|
|
|
|
|
|
Keel1 |
0.500 |
47.16 |
74.31 |
16.46 |
|
Keel2 |
0.500 |
48.17 |
75.60 |
17.93 |
|
Keel3 |
0.500 |
47.91 |
75.59 |
18.91 |
|
Keel4 |
0.500 |
48.19 |
75.74 |
17.53 |
|
Keel5 |
0.499 |
47.85 |
75.09 |
17.30 |
|
Average |
0.500 |
47.856 |
75.266 |
17.626 |
|
Std
Dev |
0.000 |
0.418 |
0.589 |
0.897 |
Appendix V – Chemical Analyses From Sensitivity Tests
|
Iron used in chemically bonded sand - chemical analysis |
|||||
|
|
|
C |
3.59 |
|
|
|
|
|
S |
0.011 |
|
|
|
|
|
P |
0.04 |
|
|
|
|
|
Si |
2.27 |
|
|
|
|
|
Mn |
0.13 |
|
|
|
|
|
Cr |
0.02 |
|
|
|
|
|
Ni |
0.03 |
|
|
|
|
|
Mo |
0.01 |
|
|
|
|
|
Al |
0.017 |
|
|
|
|
|
Cu |
0.01 |
|
|
|
|
|
Ti |
< .005 |
|
|
|
|
|
Sn |
< .005 |
|
|
|
|
|
Mg |
0.045 |
|
|
|
|
|
|
|
|
|
|
|
|
|
|
|
|
|
|
|
|
|
|
|
|
Iron used in Green Sand - chemical analysis |
|||||
|
|
Ladle-1 |
Ladle-2 |
Ladle-3 |
Ladle-4 |
Ladle-5 |
|
C |
3.74 |
3.7 |
3.73 |
3.71 |
3.68 |
|
S |
0.013 |
0.011 |
0.013 |
0.014 |
0.014 |
|
P |
0.016 |
0.016 |
0.016 |
0.016 |
0.016 |
|
Si |
2.54 |
2.53 |
2.6 |
2.52 |
2.61 |
|
Mn |
0.26 |
0.27 |
0.27 |
0.26 |
0.27 |
|
Cr |
0.03 |
0.04 |
0.03 |
0.03 |
0.03 |
|
Ni |
0.04 |
0.05 |
0.04 |
0.04 |
0.04 |
|
Mo |
0.03 |
0.03 |
0.03 |
0.03 |
0.03 |
|
V |
0.005 |
0.005 |
0.005 |
0.005 |
< .005 |
|
Al |
0.014 |
0.015 |
0.016 |
0.015 |
0.015 |
|
Cu |
0.21 |
0.2 |
0.23 |
0.23 |
0.23 |
|
Mg |
0.043 |
0.047 |
0.043 |
0.042 |
0.041 |
|
Sn |
0.005 |
0.005 |
0.005 |
0.005 |
0.005 |
Appendix Vi
Microstructure Comparison
Green Sand Molds
|
Sample |
As Cast Dia., In. |
% ASTM Types I & II |
Nod. Ct/mm2 |
% Ferrite |
% Carbide |
Skin Depth, Inches |
Soundness |
|
L2P1 |
0.625 |
95 |
150 |
75 |
ND |
N/A |
Acceptable |
|
L2P2 |
0.625 |
95 |
150 |
65 |
ND |
N/A |
Acceptable |
|
L2P3 |
0.500 |
95 |
150 |
60 |
ND |
N/A |
Acceptable |
|
L2P4 |
0.375 |
90 |
150 |
50 |
ND |
N/A |
Acceptable |
|
L2P5 |
0.250 |
95 |
200 |
80 |
ND |
0.0014 |
Acceptable |
|
L2P6 |
0.375 |
95 |
150 |
65 |
ND |
0.0028 |
Acceptable |
|
L2P7 |
0.500 |
95 |
150 |
65 |
ND |
0.0026 |
Acceptable |
|
L2P8 |
0.500 |
95 |
150 |
75 |
ND |
0.0022 |
Acceptable |
|
L2 Keel |
- |
95 |
75 |
75 |
ND |
N/A |
Acceptable |
|
L5P1 |
0.625 |
95 |
150 |
65 |
ND |
N/A |
Acceptable |
|
L5P2 |
0.500 |
95 |
150 |
60 |
ND |
N/A |
Acceptable |
|
L5P3 |
0.375 |
95 |
150 |
60 |
ND |
N/A |
Acceptable |
|
L5P4 |
0.250 |
95 |
150 |
50 |
ND |
N/A |
Acceptable |
|
L5P5 |
0.375 |
95 |
200 |
75 |
Trace |
0.0014 |
Acceptable |
|
L5P6 |
0.500 |
90 |
200 |
75 |
ND |
0.0018 |
Dross |
|
L5P7 |
0.500 |
95 |
150 |
65 |
ND |
0.0020 |
Acceptable |
|
L5P8 |
0.625 |
95 |
150 |
65 |
ND |
0.0014 |
Acceptable |
|
L5 Keel |
|
95 |
75 |
65 |
ND |
N/A |
Acceptable |
Microstructure Comparison
Chemically Bonded Sand Molds
|
Sample |
As Cast Dia., In |
% ASTM Types I & II |
Nod. Ct/mm2 |
% Ferrite |
% Carbide |
Skin Depth, Inches |
Soundness |
|
A1 |
0.625 |
95 |
150 |
75 |
ND |
N/A |
Acceptable |
|
A2 |
0.625 |
95 |
150 |
75 |
ND |
N/A |
Acceptable |
|
A3 |
0.500 |
95 |
150 |
60 |
ND |
N/A |
Acceptable |
|
A4 |
0.375 |
95 |
150 |
50 |
ND |
N/A |
Acceptable |
|
A5 |
0.250 |
95 |
200 |
40 |
7--9 |
0.0015 |
Acceptable |
|
A6 |
0.375 |
95 |
150 |
50 |
ND |
0.0015 |
Acceptable |
|
A7 |
0.500 |
95 |
150 |
60 |
ND |
0.0018 |
Acceptable |
|
A8 |
0.500 |
95 |
150 |
60 |
ND |
0.0018 |
Acceptable |
|
D1 |
0.625 |
95 |
150 |
75 |
ND |
N/A |
Acceptable |
|
D2 |
0.500 |
95 |
150 |
60 |
ND |
N/A |
Acceptable |
|
D3 |
0.375 |
95 |
150 |
50 |
ND |
N/A |
Acceptable |
|
D4 |
0.250 |
95 |
150 |
50 |
ND |
N/A |
Acceptable |
|
D5 |
0.375 |
95 |
200 |
30 |
15--20 |
0.0015 |
Acceptable |
|
D6 |
0.500 |
95 |
200 |
40 |
ND |
0.0026 |
Acceptable |
|
D7 |
0.500 |
95 |
150 |
60 |
ND |
0.0036 |
Acceptable |
|
D8 |
0.625 |
95 |
150 |
60 |
ND |
0.0018 |
Acceptable |
|
Y-Block |
|
95 |
75 |
75 |
ND |
N/A |
Acceptable |
Appendix VII
Microprobe Chemical Analysis
Green Sand, %
|
Element |
Bulk Analysis |
Core Pearlite |
Core Ferrite |
|
Carbon |
3.68 |
-- |
-- |
|
Sulfur |
0.014 |
0.000 |
0.012 |
|
Silicon |
2.61 |
2.182 |
2.920 |
|
Manganese |
0.27 |
0.505 |
0.252 |
|
Copper |
0.23 |
0.165 |
0.418 |
|
Magnesium |
0.041 |
0.033 |
0.015 |
|
Element |
Bulk Analysis |
At the surface |
Surface Pearlite |
Surface Ferrite |
|
Carbon |
3.68 |
-- |
-- |
-- |
|
Sulfur |
0.014 |
0.000 |
0.008 |
0.002 |
|
Silicon |
2.61 |
2.188 |
2.544 |
2.665 |
|
Manganese |
0.27 |
0.259 |
0.224 |
0.235 |
|
Copper |
0.23 |
0.148 |
0.391 |
0.396 |
|
Magnesium |
0.041 |
0.020 |
0.000 |
0.000 |
Chemical Bonded Sand, %
|
Element |
Bulk Analysis |
Core Pearlite |
Core Ferrite |
|
Carbon |
3.56 |
-- |
-- |
|
Sulfur |
0.011 |
0.009 |
0.010 |
|
Silicon |
2.27 |
1.623 |
2.469 |
|
Manganese |
0.13 |
0.247 |
0.093 |
|
Copper |
0.010 |
0.034 |
-- |
|
Magnesium |
0.040 |
0.039 |
0.000 |
|
Element |
Bulk Analysis |
At the surface |
Surface Pearlite |
Surface Ferrite |
|
Carbon |
3.56 |
-- |
-- |
-- |
|
Sulfur |
0.011 |
0.164 |
0.008 |
0.010 |
|
Silicon |
2.27 |
1.952 |
1.979 |
2.265 |
|
Manganese |
0.13 |
0.249 |
0.029 |
0.126 |
|
Copper |
0.010 |
0.019 |
0.044 |
0.010 |
|
Magnesium |
0.040 |
0.000 |
0.023 |
0.000 |